The Engineer's Survival Workshop: Difference between revisions
No edit summary |
No edit summary |
||
| Line 38: | Line 38: | ||
<div class="carousel-inner" role="listbox"> | <div class="carousel-inner" role="listbox"> | ||
<div class="item active"> | <div class="item active"> | ||
[[File:bad1.png | [[File:bad1.png|class=img-responsive]] | ||
</div> | </div> | ||
<div class="item"> | <div class="item"> | ||
[[File:bad2.png | [[File:bad2.png|class=img-responsive]] | ||
</div> | </div> | ||
</div> | </div> | ||
Latest revision as of 08:12, 27 December 2020
While at ETH Zürich, we had an opportunity to create side classes at the bachelor level to introduce hands on aspects of our fields. For several semesters I tried to put together a (so called P&S or PPS) lecture where I also experimented with different teaching methods.
There are many useful skills needed for an engineering career, which are not really taught as part of a class. How to make basic use of Unix, use Shell scripting and understanding what Regular Expressions can do for you. Most of the life of an engineer is documenting and presenting the work, but few lectures concentrate on how to make Presentations and especially how to prepare Tables and Figures. The idea behind the course was to combine these themes in a class that encourages group work.
While ultimately the class did not work out, I ended up with some good material that I wanted to keep here.
How it started
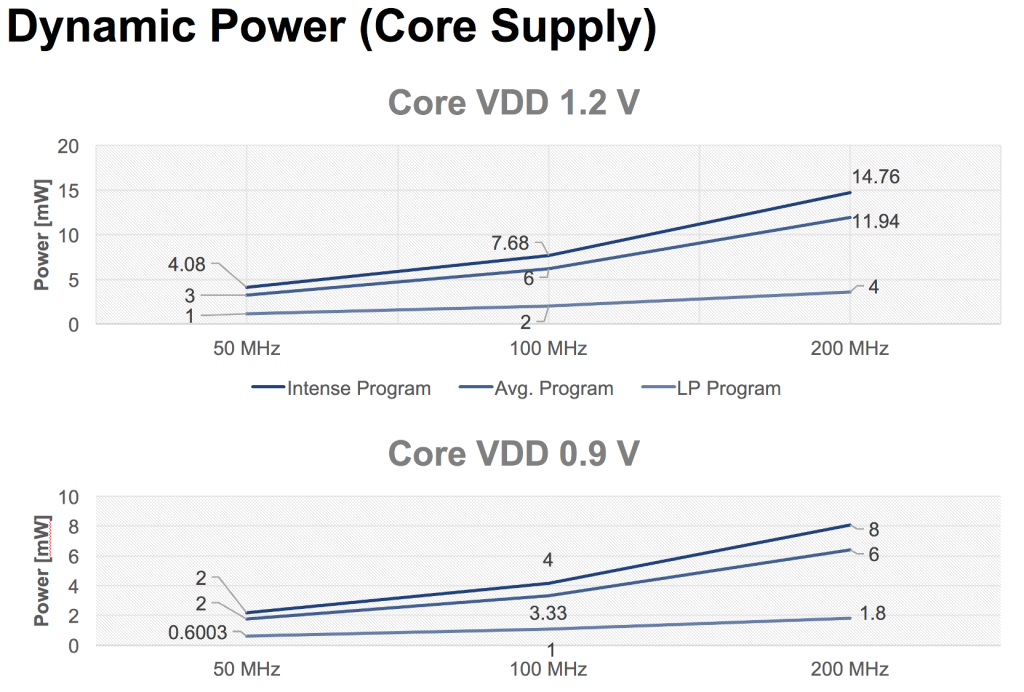
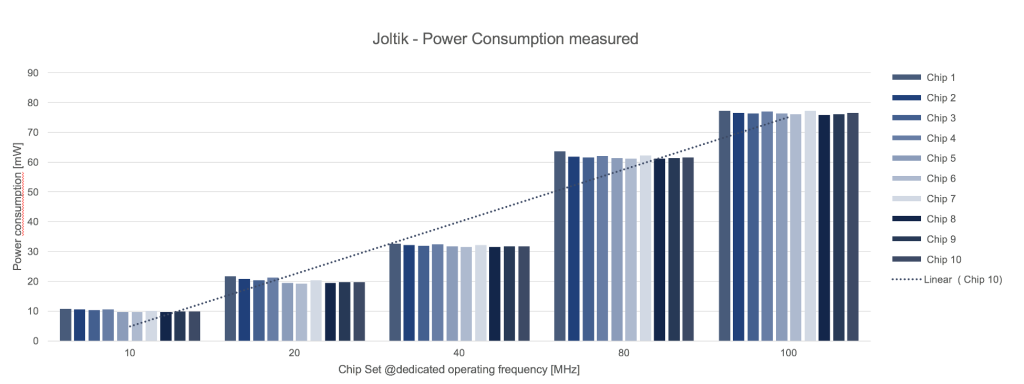
I was teaching a class on IC Testing which had oral exams for which the students had to present their results in a short presentation. Two students independently presented the two figures on the right, which were not very well prepared although they looked kind of ok.
I have a longer rant on what is wrong with these figures, but the key message that they should be giving is that there is a linear relationship between frequency and (dynamic) power. You basically want to see the data points fall on a straight line. One did not have a straight like as the axis was not linear, and the other managed a straight line although the axis was also not linear.
I wanted to have a lecture where students learned not to make these basic mistakes, or at least beware of some of the aspects what makes a better figure. The class evolved around these ideas.
Class Structure
The class was every week three hours and for 20 to 30 students in a computer room. Every week covered one topic but the topics were spread over consecutive weeks.
Previous topic
- 5 min introduction to the day,
- 45 min, 3 to 5 presentations from the previous topic, with a short discussion
- 15 min, wrap up of the topic.
New topic
- 30 min, introduction to the new topic
- 45 min, tasks for next week, forming 3-5 groups and organizing the presentations of the next week
Lecture plan
The exact plan changed from semester to semester, as I tried to adjust but a typical semester was structured like the following
- Why do you think you can learn from me
- Every presentation is an opportunity to learn something
- You will see yourself and your mistakes in presentations of your friends
- You will find ideas that you think you could try as well
Everyone can give good technical presentations/write good reports. Some are able to do it with less effort, does not mean that you can not do it. Follow this simple template:
- Who are you,
- Why are you here, What is the problem, and why should we care
- What have others done to solve it,
- Why is that not good enough, what will you do better
- What is your solution, how does it work
- How can you show that it is better than what was done before, your methods
- What are the results
- Summarize your main point.
There is too much information out there that is not factual, a large portion of them written by people who do not know it much better than you. Finding proper information will get more difficult as you advance in your career. Differentiating good information from incomplete, inaccurate, harmless, useless, plain wrong will be one of your key skills.
Data is valuable, do not give it away unnecessarily.
There are many free online tools (facebook, dropbox, skype, gmail). You will always be paying for a service, know what the price is. Some transactions you make privately may not be worth it in your professional career.
It is not the tools, it is how you use them. Just because there is a new fancy tool/GUI/online service, your problems will not be magically solved. Tools can help you, but ultimately it is always how you use them.
- Dictators vs Democracy on online collaboration
- Issue of keeping track of who does what
- Latency of communication
We use mostly computers, we edit text, write code, run different applications with different parameters. We will be doing them for many years to come. Invest some time so that you can learn how to do complex tasks more easily. Scripting/regular expressions
A key skill in enginnering is experience: You will pick up small tricks that you store in a little (mental) box as you progress in your career. These will end up making the difference, so make sure that you pick up something at every opportunity.
- Now that we can make simple scripts, can we do it better?
- Regularity is key to handling complexity
- Common regular expressions
- Images bitmap vs vectors
- How is color coded
- Cameras (RGB pixels)
- Images for reports, presentations
- DPI, resolution, color depth, quality
- Figures should help us understand things
- What type of figures do we have in engineering and scientific work
- plots
- drawings
- block diagrams
- Discuss good figures, bad figures examples
- Do I need a table?
- Borders or no borders
- Alignment
- Structure
- Using gnuplot
- Making a point
Fix a bad presentation
Let's talk about the class


